Slope-Intercept Form
Using Slope-Intercept Form
When the equation of a line is in slope-intercept form the graph can be drawn using the slope, m, and y-intercept. Remember that slope is a ratio representing the amount the line "rises" over how much it "runs" or ![]() .
.
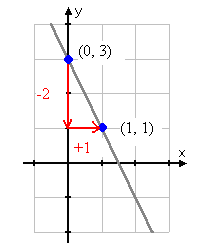
Example Graph y = -2x + 3 using the slope and y-intercept.
Step 1. Determine the slope and y-intercept and convert the slope to a fraction.
m = ![]() and b = 3
and b = 3
The slope means the graph will go "down two" and "to the right one" for each new point.
To Graph:
Step 1. Begin with the y-intercept, (0, 3)
Step 2. Using slope, go down two and right one to get the next point, (1, 1).
