Graphing
Systems of Inequalities
Example Continued
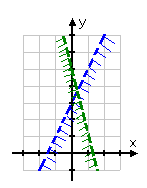
Step 3. On the same coordinate plane, graph inequality 2.
y < -4x + 5

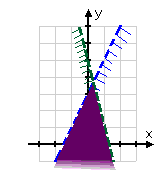
Step 4. State the solution set of the system.

Since the solution set is where the shading overlaps, the purple portion of the graph represents all solutions of the system of inequalities.