Graphing
| Site: | Clare |
| Course: | Michigan Algebra I Sept. 2012 |
| Book: | Graphing |
| Printed by: | Guest user |
| Date: | Sunday, February 1, 2026, 1:21 PM |
Description
Solving Equations
A system of equations is two or more linear equations that model the same situation. The solution to a linear system of equations is the point which lies on both lines. In other words, the solution is the point where the two lines intersect.
One way to solve a system of equations is by graphing the lines on the same coordinate plane and reading the intersection point from the graph. This method most often offers approximate solutions. Exact answers are found in the rare case when the x and yvalues of the solution are integers. However, this method is great at offering a visual representation of the system of equations and demonstrates that the solution to a system of equations is the intersection of the two lines.
Example
Solve the following system of equations by graphing.

Step 1. Graph both lines on the same coordinate axes using your method of choice.
Since these two lines are in standard form, finding intercepts is an appropriate method of graphing.
Line 1
2x +3y = 6
When x = 0, y = 2 which results in (0,2)
When y = 0, x = 3 which results in (3, 0)
Line 2
4x -y = -2
When x = 0, y = 2 which results in (0, 2)
When y = 0, x = ![]() which results in (
which results in ( ![]() , 0)
, 0)
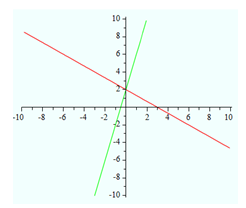
The graph shows that the lines intersect at (0,2).
Therefore the solution is x = 0, y = 2.
Using a Graphing Calculator
A graphing calculator can be used to find or check solutions to a system of equations. It can be used as an alternative to graphing the equations by hand. The following example will show graphing using a TI-84 calculator.
Example Solve the following system of equations using a graphing calculator.

Step 1. Rewrite each equation in slope-intercept form in order to isolate y.
Line 1: 
Line 2: 
Step 2. Press the [y=] button on the graphing calculator and enter the two functions as:

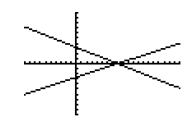
Step 3. Now press [GRAPH].
| The window for this graph is set to: x min: -5 |
Example Continued
Step 4. Find the intersection point.
Option 1: Use [TRACE] and move the cursor with the arrows until it is on top of the intersection point. The values of the coordinate point will be on the bottom of the screen. Using the window above, the values will be x = 4.0957447 and y = 0.03191489. These are approximations due to the pixels on the graph screen.
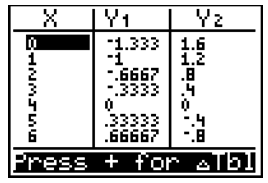
Option 2: Look at the table of values by pressing [2nd][GRAPH]. The screen below shows a table of values for this system of equations. Scroll down until the values for y1 and y2 are the same. In this case, this occurs at x = 4 and y = 0.
Option 3: Using the [2nd][TRACE] function will allow you to calculate a value.
- Press [ENTER] and the calculator displays the solution at the bottom of the screen
The point of intersection is x = 4 and y = 0.
Interactive
To investigate with a graphing interactive, select the following link:
Guided Practice
To solidify your understanding of solving systems by graphing, visit the following link to Holt, Rinehart and Winston Homework Help Online. It provides examples, video tutorials and interactive practice with answers available. The Practice and Problem Solving section has two parts. The first part offers practice with a complete video explanation for the type of problem with just a click of the video icon. The second part offers practice with the solution for each problem only a click of the light bulb away.
Video Lesson
To see more examples on solving linear systems by graphing, select the following links:
Practice
*Note:If Google Docs displays "Sorry, we were unable to retrieve the document for viewing," refresh your browser.
Answer Key
*Note:If Google Docs displays "Sorry, we were unable to retrieve the document for viewing," refresh your browser.
Systems of Inequalities
Graphing systems of inequalities is done the same way as graphing a linear inequality. However, multiple shadings will have to be considered and the solution will be the set of ordered pairs satisfying the requirements of the given inequalities.
Example Solve the following system:
2x - y > -3
4x + y < 5
Step 1. Re-write the inequalities to isolate "y."
y < 2x + 3
y < -4x + 5
Step 2. Graph inequality 1 as shown earlier in this unit.
y < 2x + 3

Example Continued
Step 3. On the same coordinate plane, graph inequality 2.
y < -4x + 5
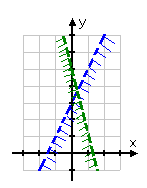
Step 4. State the solution set of the system.
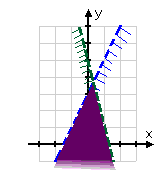
Since the solution set is where the shading overlaps, the purple portion of the graph represents all solutions of the system of inequalities.
Using a Graphing Calculator
A graphing calculator can be used to find or check solutions to a system of inequalities. A graphing calculator can be used to graph the lines as an alternative to graphing the equations by hand. The following example will show graphing using a TI-84 calculator.
Example Solve the following system:
2x - y > -3
4x + y < 5
Step 1. Re-write the inequalities to isolate "y."
y < 2x + 3
y < -4x + 5
Step 2. Replace the inequality sign with an equal sign.Press the [y=] button on the graphing calculator and enter the two functions as:
y = 2x + 3 and y = -4x + 5
Example Continued
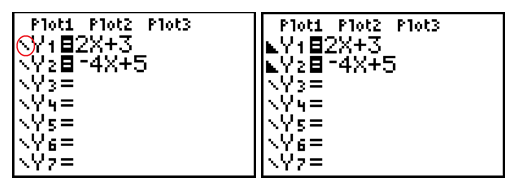
Push [ENTER] until the shade below symbol is displayed
(since the inequality was a less than symbol).
Do the same for Y2.
Step 4. Now press [GRAPH].
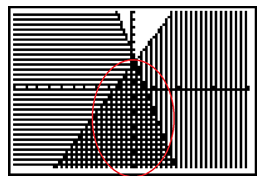
The solution set is the area shaded by both lines.
Video Lesson
To see more examples on graphing systems of inequalities, select the following links:
Guided Practice
To solidify your understanding of solving systems of inequalities, visit the following link to Holt, Rinehart and Winston Homework Help Online. It provides examples, video tutorials and interactive practice with answers available. The Practice and Problem Solving section has two parts. The first part offers practice with a complete video explanation for the type of problem with just a click of the video icon. The second part offers practice with the solution for each problem only a click of the light bulb away.
Practice
Graphing Systems of Inequalities Worksheet
*Note: If Google Docs displays "Sorry, we were unable to retrieve the document for viewing," refresh your browser.
Answer Key
Graphing Systems of Inequalities Key
*Note:If Google Docs displays "Sorry, we were unable to retrieve the document for viewing," refresh your browser.
Sources
Andrew and Anne Gloag, This chapter covers solving systems of equations graphically, Created: Jan. 18, 2010, http://www.ck12.org/flexr/search/Linear%20systmes%20of%20Equations/
Holt, Rinehart, & Winston. "Linear Systems." http://my.hrw.com/math06_07/nsmedia/homework_help/alg2/
alg2_ch03_03_homeworkhelp.html (accessed August, 5, 2010)
Holt, Rinehart, & Winston. "Linear Systems." http://my.hrw.com/math06_07/nsmedia/homework_help/alg1/
alg1_ch06_01_homeworkhelp.html (accessed August, 5, 2010)
Stapel, Elizabeth. "Systems of Linear Inequalities." Purplemath. Available from http://www.purplemath.com/modules/syslneq2.htm. Accessed 05 August 2010Â
