Graphing
Systems of Inequalities
Example Continued
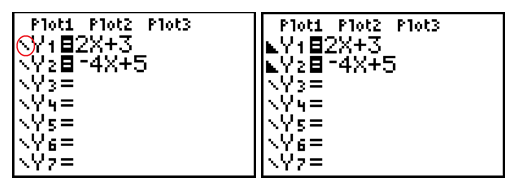
Step 3.Arrow to the far left side of Y1.

Push [ENTER] until the shade below symbol is displayed
(since the inequality was a less than symbol).
Do the same for Y2.
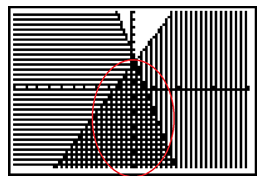
Step 4. Now press [GRAPH].

The solution set is the area shaded by both lines.