Displaying Data
| Site: | Clare |
| Course: | Michigan Algebra I Sept. 2012 |
| Book: | Displaying Data |
| Printed by: | Guest user |
| Date: | Monday, January 5, 2026, 2:02 AM |
Description
Displaying Data
Introduction
Types of Displays
Basics of Graphing
For a refresher on the basics of graphing on a coordinate plane, select the following link:
Graphing on Coordinate Plane
Video Lesson
For a video lesson and review of tables and line plots select the following link:
For a video lesson and review of stem-and-leaf plots select the following link:
Guided Practice
Guided Practice #1
Guided Practice #2
Misleading Graphs
The following is a list of ways to make a graph misleading:
- The scale is too narrow or there is not a big enough range. Data looks like it has a big difference when really it does not.
- There is no scale at all.
- The bars are not equal widths.
- The intervals on the graph are not equal, but are depicted as equal.
- There is missing information.
Example 1

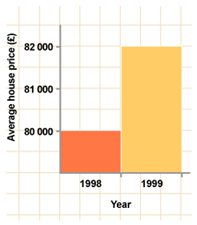
Step 1. Look at the graph critically for misleading information in the scale, increments, or labels.
From this graph, it looks as though house prices have tripled in one year! It is misleading because the vertical axis does not start at 0.
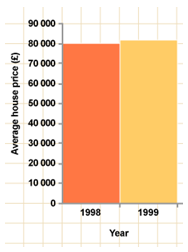
Step 2. Make a new graph by changing the misleading part of the original.
In this case it is important to fix the scale of the vertical axis.

Example 2

Step 1. Look at the graph critically for misleading information in the scale, increments, or labels.
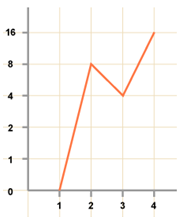
Although the vertical scale starts at 0, it does not go up in even steps. This distorts the graph, and makes it look as though the biggest jump is between 1 and 2, rather than 3 and 4.
Also, there are no labels on the axes, so we have no idea what this graph represents!
Video Lesson
Misleading Graphs Video
Guided Practice
Guided Practice
Interactive Quiz
Interpreting Data Quiz
For an interactive quiz on misleading graphs, select the following link:
Misleading Graphs Quiz
Practice
Answer Key
Sources
GSCE Bitesize, http://www.bbc.co.uk/schools/ gcsebitesize/maths/data/representingdata2rev5.shtml (accessed 08/30/2010).
Glencoe, "Self Check Quizzes." http://www.glencoe.com/sec/math /studytools/cgi-bin/msgQuiz.php4?isbn=0-07-829631-5&chapter=2&lesson=4&headerFile=4&state=na (accessed 08/24/2010).
Holt, Rinehart, and Winston, http://go.hrw.com/math/midma/ gradecontent/loadlesson.html?course=c3&chapter=4&lesson=5&SE=1&sz_audio=1&calc=1&state=xx&actCourse=4 (accessed 08/24/2010).
Holt, Rinehart, and Winston, http://my.hrw.com/math06_07/ nsmedia/lesson_videos/msm3/player.html?contentSrc=6268/6268.xml (accessed 08/24/2010).
Holt, Rinehart, and Winston, "Recognizing Misleading Graphs." http://my.hrw.com/math06_07/nsmedia/homework_help/alg1/alg1_ch10_04_homeworkhelp.html (accessed 08/24/2010).
Holt, Rinehart, and Winston, "Quiz." http://go.hrw.com/math/midma/ gradecontent/loadlesson.html?course=c3&chapter=4&lesson=6&SE=1&sz_audio=1&calc=1&state=xx&actCourse=4 (accessed 08/24/2010).
Holt, Rinehart, and Winston, "Which Display is Best?." http://my.hrw.com/math06_07/nsmedia/homework_help/msm3/msm3_ch09_08_homeworkhelp.html (accessed 08/24/2010).
Math Forum, "An Introduction to the Coordinate Plane." http://mathforum.org/cgraph/cplane/ (accessed 08/24/2010).