Graphing
| Site: | Clare |
| Course: | Michigan Algebra I Sept. 2012 |
| Book: | Graphing |
| Printed by: | Guest user |
| Date: | Wednesday, 11 February 2026, 3:32 AM |
Description
Introduction
The functions known as power functions, are represented by the function, f(x) = kxp, where k is any real number and p is any real number exponent. The shape of the graph, y = kxp, depends on the sign of k and the value of p. The coefficient k will affect the scale of the graph and, if negative, will reflect the graph across the x-axis.
Functions Where p > 1
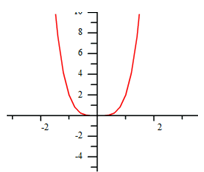
When p > 1 and an even number, the shape of the graph will be like a parabola. If the k-value is positive the graph will open up and y will approach positive infinity as x approaches both positive and negative infinity. If the k-value is negative the graph will open down and y will approach negative infinity as x approaches both positive and negative infinity. The graph below represents the function, ![]() .
.
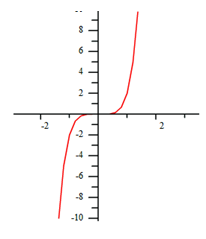
When p > 1 and an odd number, the shape of the graph will be like a cubic function. If the k-value is positive, the graph will be increasing from left to right, as x approaches positive infinity so will y, and vice versa. If the k-value is negative the graph will be decreasing from left to right, as x approaches positive infinity, y will approach negative infinity, and vice versa. The graph below represents the function, ![]() .
.
Functions Where p = 1 or p = 0
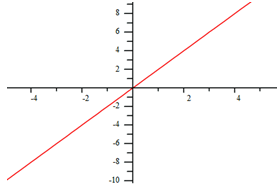
When p = 1, the graph will be a line. Since the highest degree exponent is 1, the equation is linear and holds all properties of linear functions.
The graph below represents the function, ![]() .
.
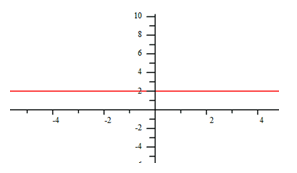
When p = 0, the graph will be a horizontal line. Since x0 = 1, the equation will be constant with no rate of change.
The graph below represents the function, ![]()
Functions Where 0 < p < 1
When 0 < p < 1, the exponent is a fractional value that can be translated to a root. Since even roots have restrictions, some of these graphs will have a restricted domain. For graphs with a restricted domain, when k is positive the x and y-values will both approach positive infinity and will both stop at (0,0). When k is negative the x and y-values will both approach negative infinity and will both stop at (0,0).
Odd roots do not have restrictions, so when k is positive both x and y will approach positive infinity, and vice versa. When k is negative, as x approaches negative infinity y will approach positive infinity, and vice versa.
The graphs below represent, f(x) = 2x0.5 and g(x) = 2x0.2.
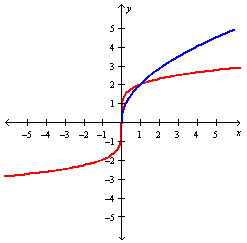
These graphs will be discussed in greater detail later in this unit.
Functions Where p < 0
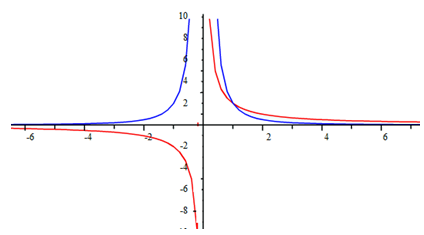
Since negative exponents create reciprocals, functions that have an exponent that is less than 0 can be represented by an equation with a variable in the denominator of a fraction. Therefore, ![]() can be rewritten as
can be rewritten as ![]() . This type of power function can come in many shapes and will include an asymptote since division by zero is undefined in mathematics.
. This type of power function can come in many shapes and will include an asymptote since division by zero is undefined in mathematics.
The graphs below represent, f(x) = 2x-2and g(x)=2x-1.
Symmetry
Symmetry is more of a geometric than an algebraic concept, but the subject of symmetry does come up in a couple of algebraic contexts. For instance, when graphing quadratics, it may be helpful to know the parabola's axis of symmetry.
The other customary context for symmetry is judging from a graph whether a function is even or odd. A function can be symmetric about a vertical line or about a point. In particular, a function that is symmetric about the y-axis is an "even" function, and a function that is symmetric about the origin is an "odd" function. Power functions that are considered even, have an even exponent and those that are odd have an odd exponent.
Examples
For each of the following graphs, list any symmetry. Then state if the graph represents an even or odd function.
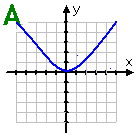
Graph A: This graph is symmetric about the line x = 0 (the y-axis). There is no other symmetry. It is considered an even function.
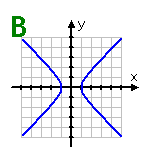
Graph B: This graph is symmetric about the lines x = 0 (the y-axis) and y = 0 (the x-axis), and also about the origin. However, since there exists vertical lines (such as the line x = 2) which will cross this graph twice, it does not represent a function.
Examples Continued
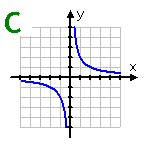
Graph C: This graph is symmetric about the lines: y = x and y = -x. It is also symmetric about the origin. Because no vertical line can cross the graph more than once, the graph is an odd function.
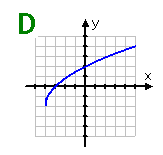
Graph D: This graph of a square-root function shows no symmetry. Although it is a function, it would not be considered even or odd.
Video Lessons
To learn how to determine a function's symmetry, select the following link:
To learn how to determine if a power function has an even or odd degree, select the following link:
Guided Practice
To solidify your understanding of graphs of power functions, visit the following link to Holt, Rinehart and Winston Homework Help Online. It provides examples, video tutorials and interactive practice with answers available. The Practice and Problem Solving section has two parts. The first part offers practice with a complete video explanation for the type of problem with just a click of the video icon. The second part offers practice with the solution for each problem only a click of the light bulb away.
Practice
*Note:If Google Docs displays "Sorry, we were unable to retrieve the document for viewing," refresh your browser.
Answer Key
*Note:If Google Docs displays "Sorry, we were unable to retrieve the document for viewing," refresh your browser.
Sources
Bogley, William A & Robson, Robby. "Power Functions."
http://oregonstate.edu/instruct/mth251/cq/FieldGuide/power/lesson.html (accessed September 3, 2010).
Embracing Mathematics, Assessment & Technology in High Schools; A Michigan Mathematics & Science Partnership Grant Project
Holt, Rinehart, & Winston. "Polynomial Function." http://my.hrw.com/math06_07/nsmedia/homework_help/alg2/alg2_ch06_07_homeworkhelp.html (accessed September 3, 2010).