Domain & Range
| Site: | Clare |
| Course: | Michigan Algebra I Sept. 2012 |
| Book: | Domain & Range |
| Printed by: | Guest user |
| Date: | Sunday, February 1, 2026, 6:56 PM |
Description
Introduction
Recall that the domain of a function is the set of all possible input values, or x-values. Therange of a function is the set of all outputs, or y-values. In other words, range is the set of all possible answers when the domain values are substituted for the input variable. Sometimes the range is difficult to determine and graphing the function may help to determine the range.
Like the quadratic functions already studied, the domain of any polynomial function is all real numbers, meaning that any value can be substituted in for x.
However, the range depends on the particular function, so graphing the function may help determine the range.
Range depends on whether the polynomial is an even or oddfunction. A polynomial is an even function when the highest degree is an even number. Odd functions are those whose highest degree is an odd number.
Odd Functions
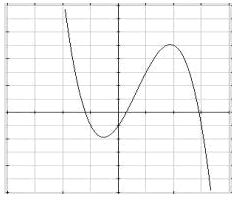
Below is a graph of the cubic function, f(x) = -x3 + 2x2 + 3x -1.

Since the function is not modeling a situation, the domain is all real numbers. From the graph, it appears that the range is also all real numbers. On a graph, the range corresponds to the vertical axis. Look up and down to see if there are any end points to help find the range. On the left side of the graph, it keeps going up with no endpoint so the range goes to positive infinity, which can be written as ![]() . On the right, the graph keeps going down. The range then goes to negative infinity,
. On the right, the graph keeps going down. The range then goes to negative infinity, ![]() . All cubic functions have similar range values.
. All cubic functions have similar range values.
In the previous chapter, end behavior of polynomials was discussed. Since all odd functions have a cubic-like shaped graph and cubic functions have similar end behavior, odd function graphs will eventually cover all possible values of y and have a range of all real numbers.
Even Functions
All even functions will have similar shaped graphs, meaning they will either open upwards or downwards. Depending on the direction they open, the range will either have an absolute minimum or maximum just like quadratic functions. The range can be determined by finding the absolute maximum or minimum of the graph.
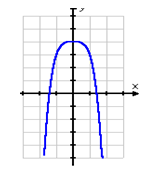
Example Find the range of y = -x4 + 4.
Step 1. Make a graph of the function.

Step 2. Determine the absolute maximum or minimum.
Since this graph is opening down, there is an absolute maximum. In this case the vertex is the point (0, 4).
Step 3. Write the range of the function.
The range of the function is all numbers less than and including 4. In set notation: ![]() .
.
*Note: Sometimes there are restrictions put on the domain, the values of x. If this is the case, plug in the minimum and maximum values of x to determine the range.
Practice
*Note: If Google Docs displays "Sorry, we were unable to retrieve the document for viewing," refresh your browser.
Answer Key
*Note: If Google Docs displays "Sorry, we were unable to retrieve the document for viewing," refresh your browser.
Sources
Earth Math, "Domain and Range." http://earthmath.kennesaw.edu/ main_site/review_topics/domain_and_range.htm (accessed 08/11/2010).
Embracing Mathematics, Assessment & Technology in High Schools; A Michigan Mathematics & Science Partnership Grant Project
Purple Math, "Functions: Domain and Range." http://www.purplemath.com/
modules/fcns2.htm (accessed 08/11/2010).